See Your Land in 3D: New Terrain, Relief & Parcel Layers
·Feature Announcement
New map layers are here — see the real shape of your land in relief and 3D, switch between satellite views, and overlay cadastral parcel boundaries right on the map.
Until now, AgroReports maps have shown your land through satellite indices — NDVI, NDWI, and the rest — as flat colours over a plain background. That’s incredibly useful for spotting stress and change, but it only tells part of the story. It doesn’t show you the shape of your land: the slopes, the ridges, the low spots where water pools, or exactly where your field ends and your neighbour’s begins.
Today, that changes. We’ve added a new set of map layers and a full 3D viewer to AgroReports, so you can finally see your land the way you experience it on foot — its relief, its elevation, its boundaries — without leaving the map.
The headline addition is a new relief layer — a shaded view of the terrain that reveals hills, valleys, and slopes in light and shadow. Built from high-resolution elevation data (down to a metre in places), it turns a flat map into something you can almost feel.
Relief layers appear automatically based on where your field is located. Wherever you’re looking, AgroReports offers the elevation layers available for that area, each with a plain-language description in your language — English, French, Spanish, Portuguese, or German.
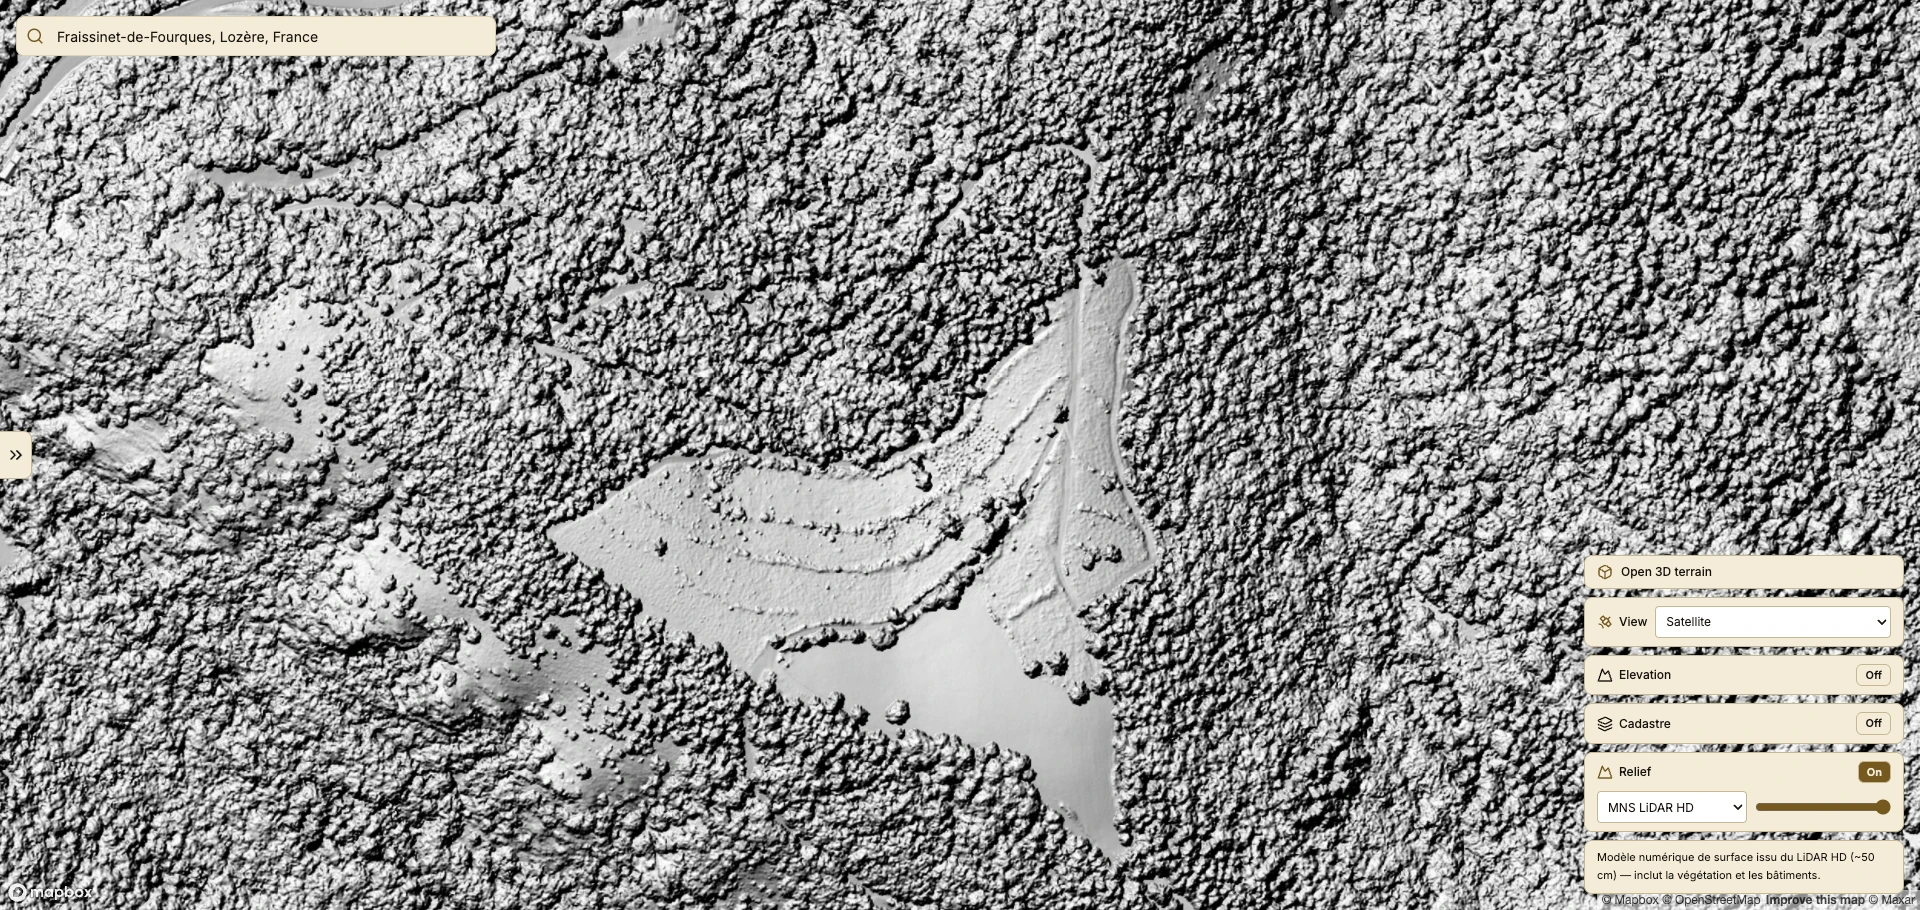
A few things worth knowing:
We’ve also added a new “View” selector to the map, so you can choose exactly how you want to see your land. Depending on the question you’re trying to answer, a different basemap can make all the difference.
You can now switch between:
Whatever view you choose, it carries through everywhere — including into the new 3D viewer.
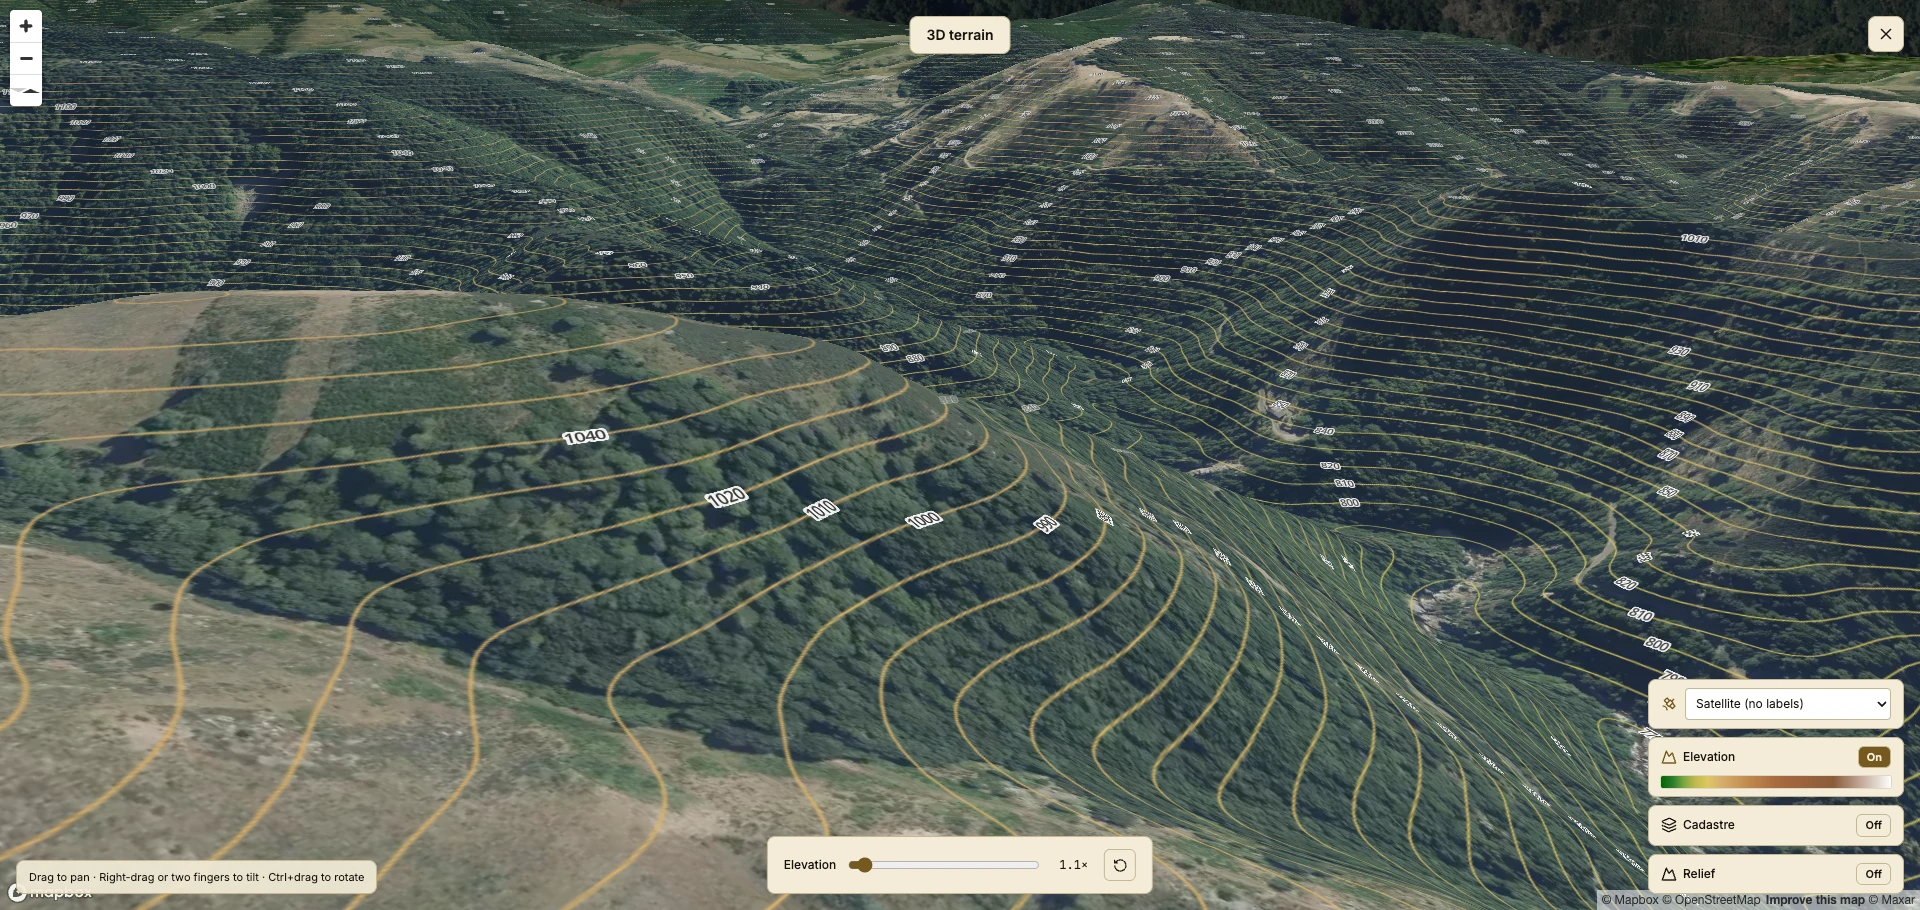
For those who think in topo lines, we’ve added an elevation contour overlay. Turn it on to see the classic contour lines that trace equal elevation across your land, with a colour legend to help you read them at a glance. It’s a small addition that makes a big difference when you’re thinking about slope, drainage, or where water will run.
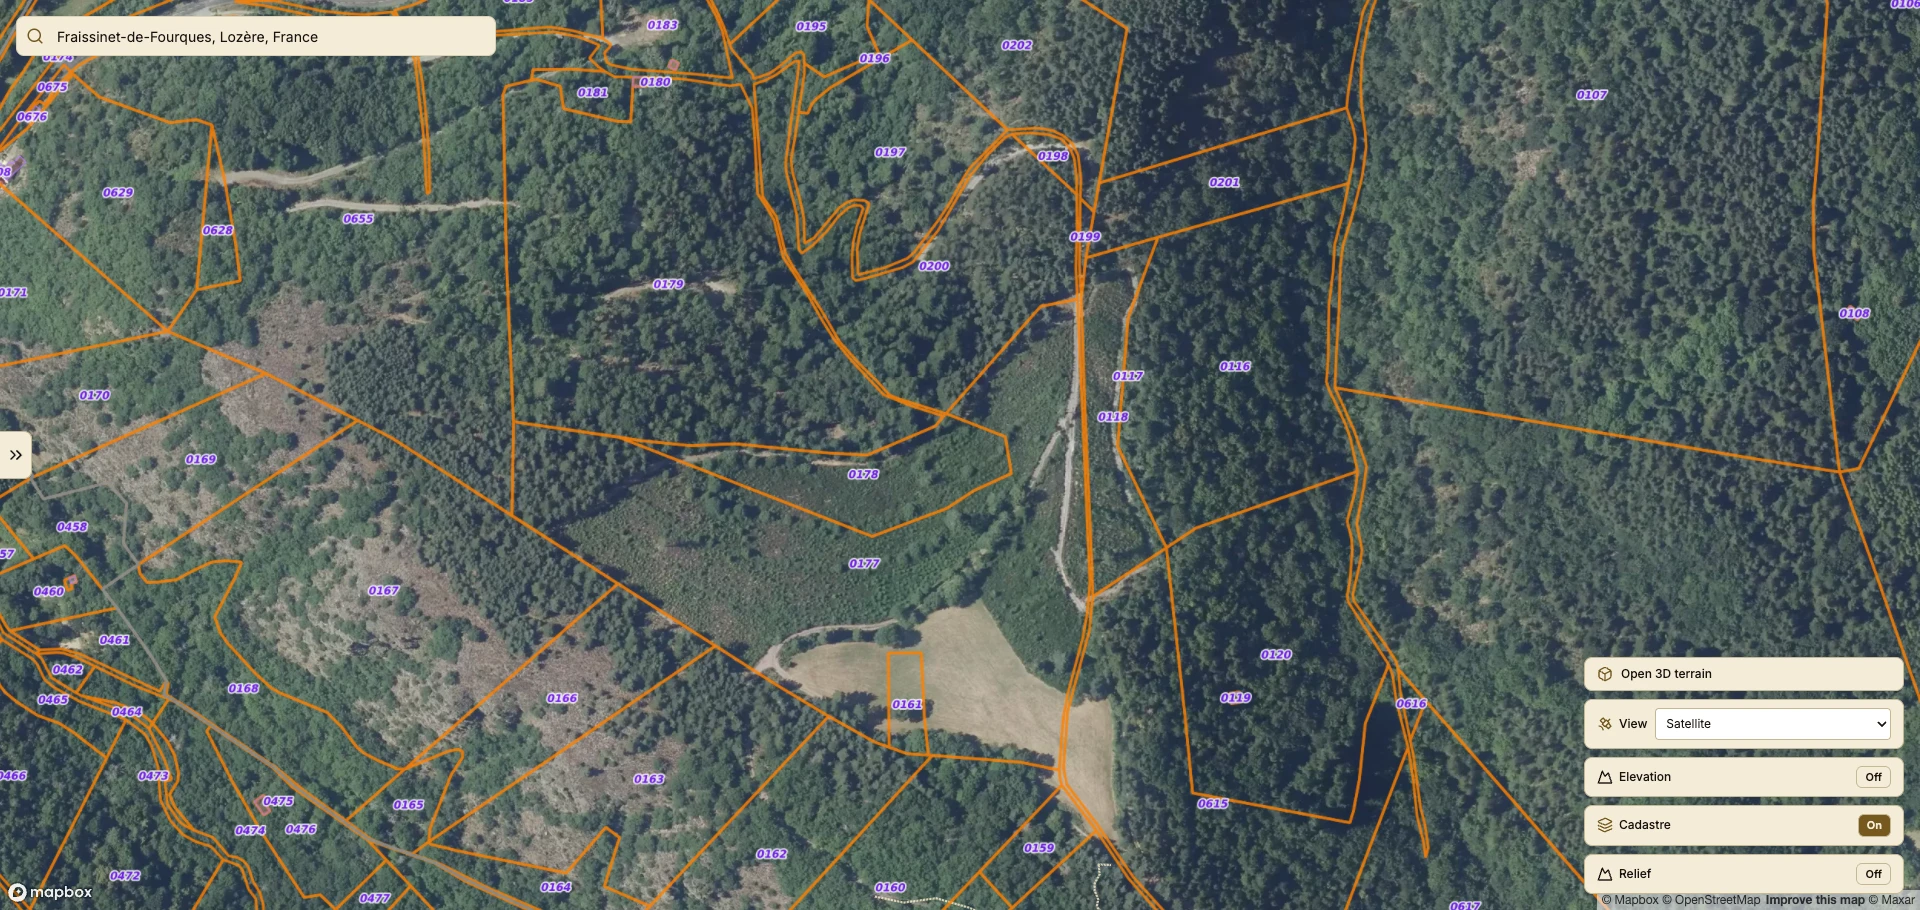
One of the most practical additions: you can now overlay official cadastral parcel boundaries directly on the map. See exactly where your field lines fall — property limits, plot shapes, and the outlines of neighbouring parcels — right on top of the satellite view. We’ve made sure these boundaries always draw above the relief hillshade, so they stay crisp and legible even on the most dramatic terrain.
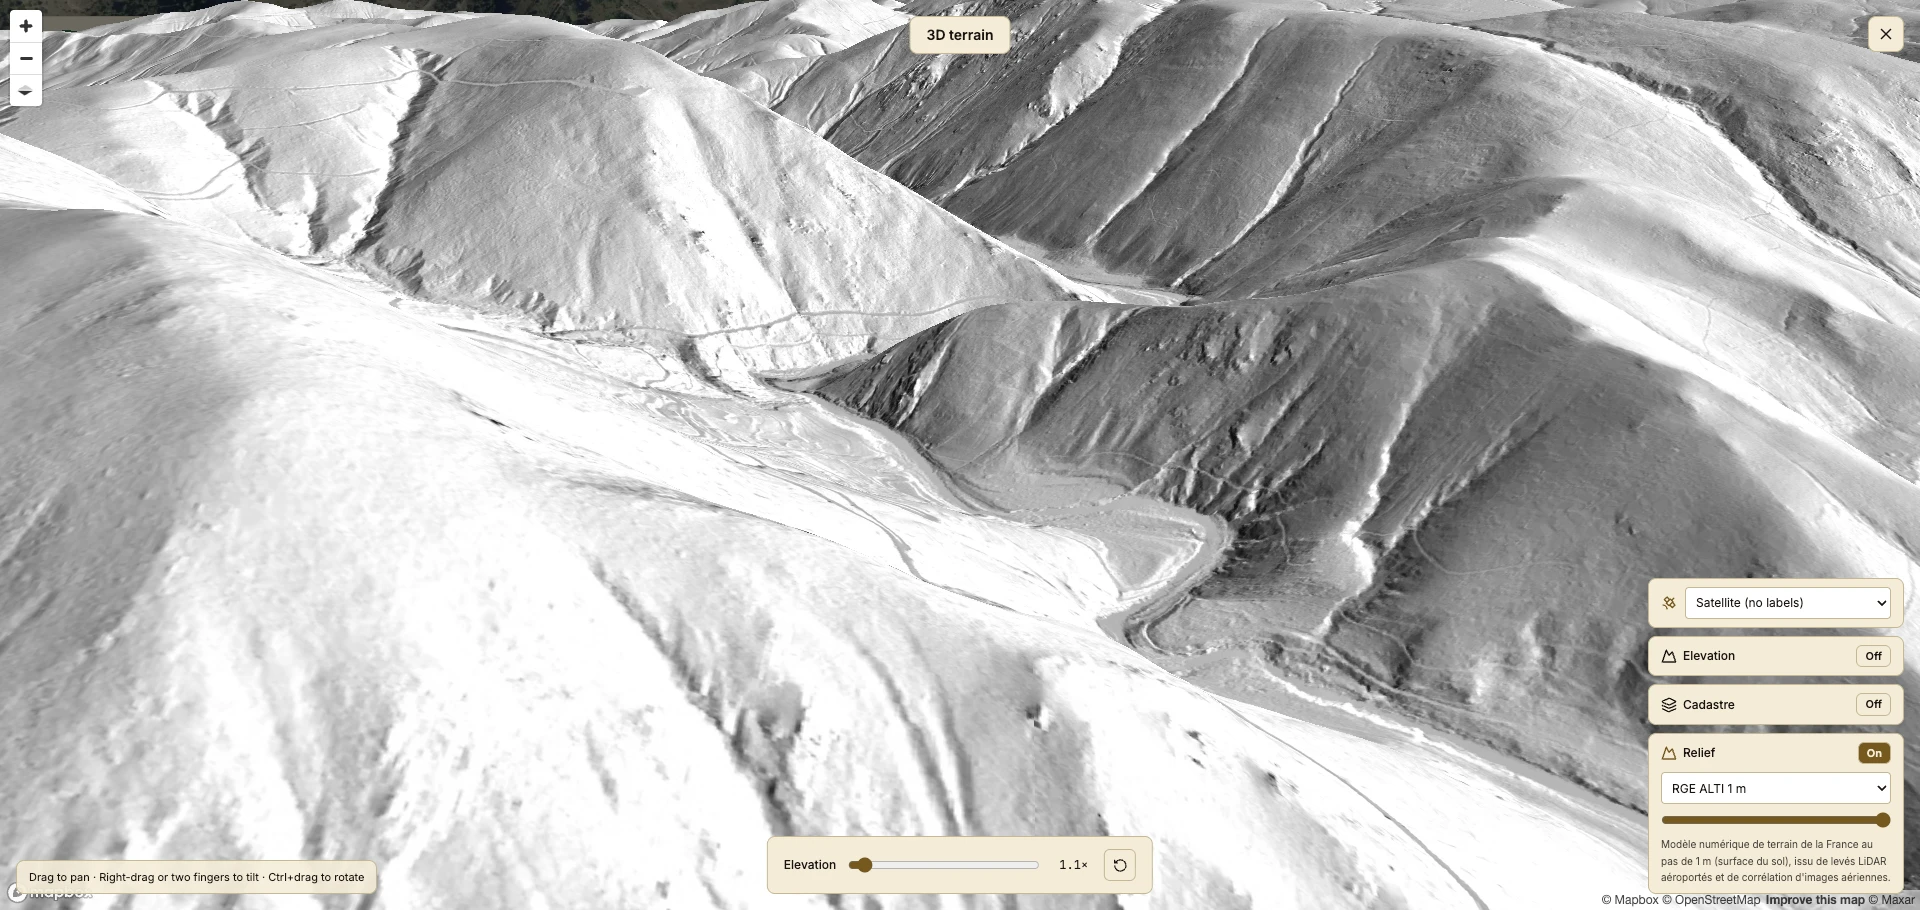
Finally, we’ve added a full-screen 3D terrain viewer. Open it from the map and your land rises up in front of you — you can rotate, zoom, and tilt the view, and exaggerate the elevation (1× to 3×) to make subtle slopes obvious.
The 3D view keeps things simple: two clean basemaps (satellite without labels, and ESRI), with the same elevation, relief, and cadastre controls you already know, tucked in the bottom-right corner just like the flat map. Everything you’ve set up on the flat map — your basemap, elevation, relief, and parcel layers — carries straight into 3D, so there’s no re-configuring.
A few smaller improvements round out the update:
The best way to understand these new layers is to see them on ground you know. Just go to app.agroreports.org and click 3D — no report or boundary drawing needed.
As always, it’s completely free.
“The sky watches every field. We translate.”
Start with my free report →No payment required. No account needed to get started.